What it does
The page opens on one question, "How do you want to start?", and three choices: a guided tour with the visitor's own screen reader, a guided tour with the app's voice, or "Explore on my own". The interface comes in English and Brazilian Portuguese.
The guided tour visits four places: the North Atlantic south of Greenland and the equatorial Pacific on the sea record, then Uberlândia (Brazil) and the miombo woodlands of Angola on the fire record, playing each record from start to end.
Exploring freely, the visitor chooses a record and one of its saved places (17 on the ocean, 13 on land), and can:
- Play through time: the values of that place become music, one date after another.
- Compare: hear the same place on two dates together. One note means little change; two notes beating against each other mean it changed.
- Hear the sound legend: low, middle, high, and the crackle that means no data.
- Ask in words: keys that say the value under the needle, the place with its latitude and longitude, and the highest and lowest places on that date.
- Open "Data and method": the source, scale, validation numbers and method of each record.
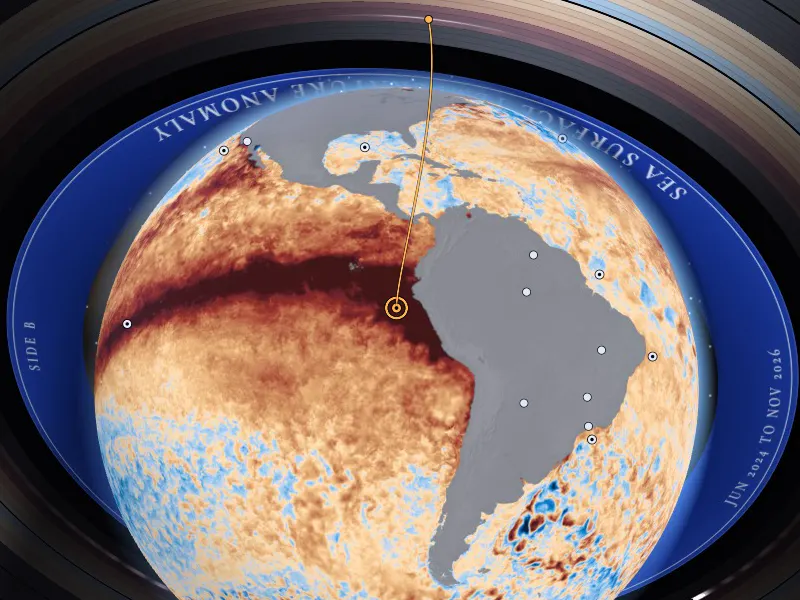
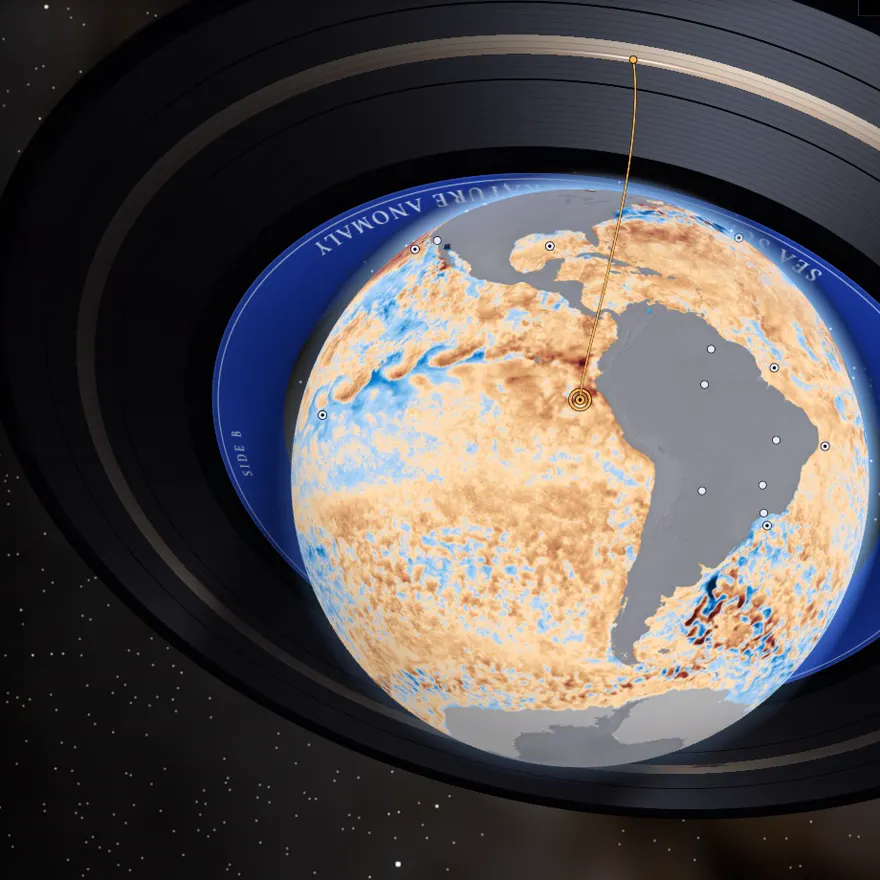
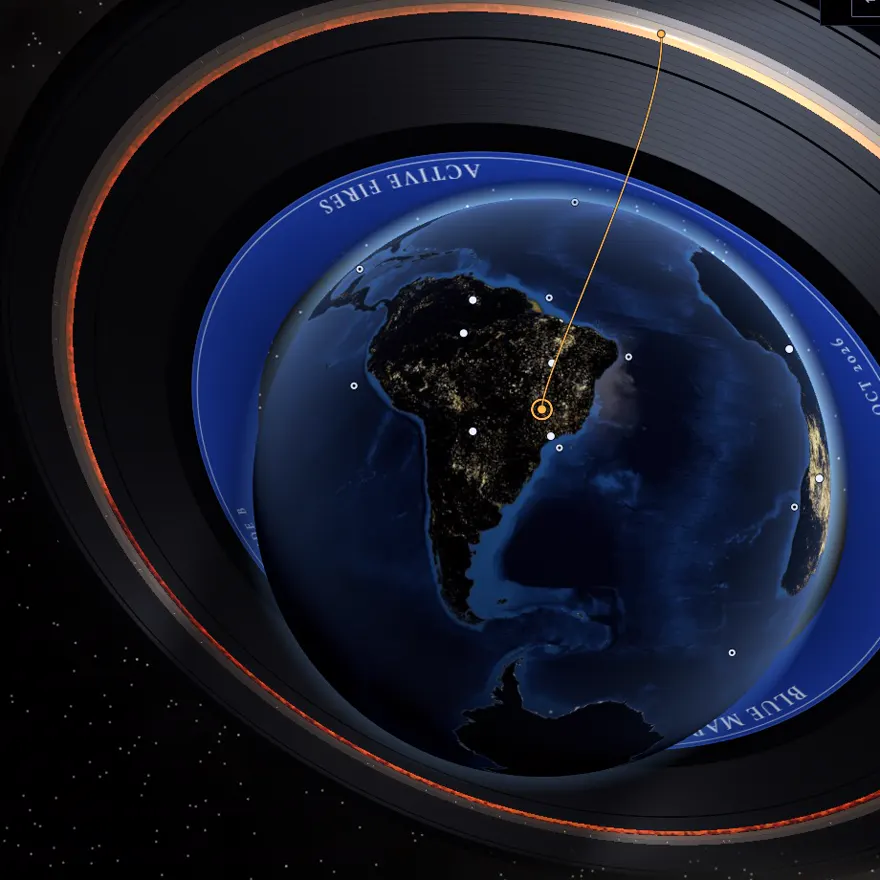
For sighted visitors the same state is drawn as a picture: the Earth in space with the NASA frame of the date laid over it, and a vinyl record around it whose grooves are the dates.
How it works
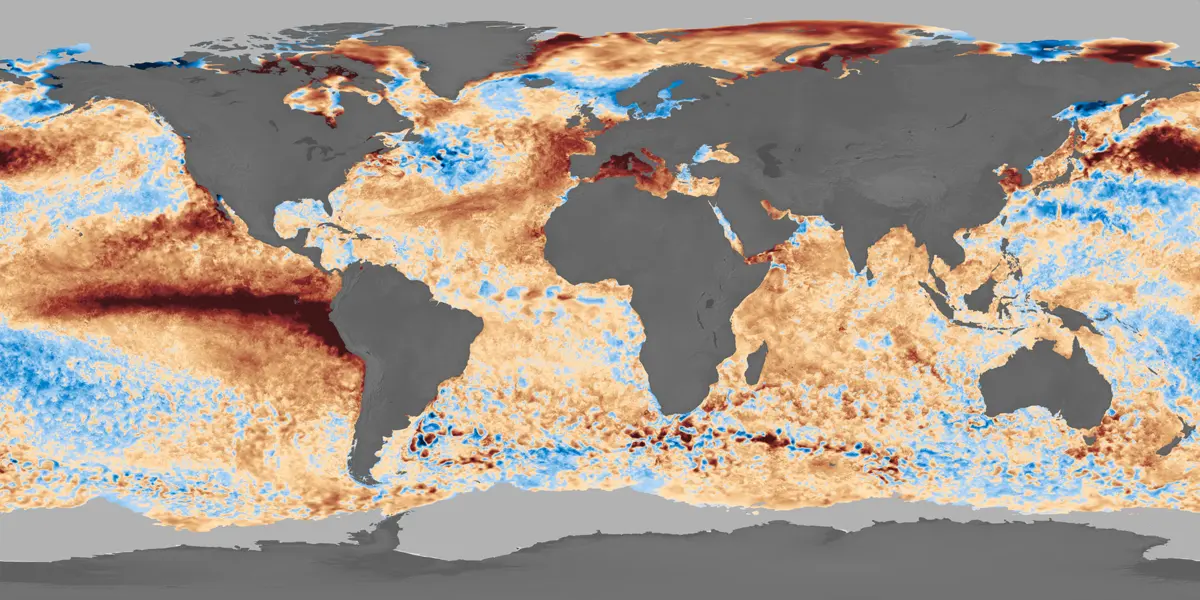
- Decoding, done ahead of time in Python. EIC frames are pictures, not data files. On the sea record, each pixel takes the value of the nearest color of the colorbar NASA publishes with the visualization, measured in the CIELAB color space; pixels far from every colorbar color (land, sea ice, coasts) are "no data". On the fire record, a pixel is fire when it differs clearly from the same pixel of an empty frame, the base map. Both are reduced to a 1 degree grid, one small image per date.
- Reading, in the browser. The needle reads the cell that contains the chosen place and turns the pixel back into a value on the record's fixed scale.
- Music, composed live. Nothing is a recorded song. The only recordings are single notes and single gestures of real instruments: our own guitar and CC0 sample libraries. Every chord, pattern and melody is decided while it plays, by rules we wrote. On the sea record the distance from normal sets the tension, warmer water sounds bright and colder water dark, and each date lasts one bar; when the temperature moves by three quarters of a degree or more, a harp runs up (warmer) or down (colder). On the fire record, more fire activity means more tension and a heavier, louder band, and the harp runs up for more fire, down for less. The place sets the key and the tempo, and the same data always gives the same music.
- Words. Each reading is also one short sentence (place, date, value, unit), built from a template and sent to a single live region for the visitor's own screen reader. No language model runs in the app, and there is no backend.
Built for the ear
- Every control is a native HTML control. The 3D picture is hidden from assistive technology, and every choice it offers is also a button, a list or a slider.
- One key map holds everywhere: up and down change the place, left and right switch between sea and fire, Space or Enter plays and pauses, Esc or S stops all sound. A keyboard guide lists every key.
- Nothing sounds until the visitor acts, and the music lowers while a sentence is announced.
- No data is never silence and never a low note: it is a soft vinyl crackle, the "dead groove".
- The optional voice guide is a synthetic voice, labelled as one. It never reads the values and never speaks over the music.
- On Android phones that can vibrate, the value is also given as 1 to 5 pulses, and no data as a rough buzz.
During the hackathon, on 15 November 2026, a blind person tried the app on her own phone, a Motorola Moto G54, with Google's Gemini on the phone. One person and one session: we report it as a first trial, not as a validation.
Benefits
- A person who cannot see the map has a way to follow one place through time, by ear and in words, without asking anyone to describe a picture.
- The mapping is fixed and written down, so a listener can learn it once and compare places and dates.
- It says what the data cannot say: a value at the end of a scale is announced as such, and fire is given as fire activity (hot-pixel density), a relative number.
- It runs in a browser, with no install and no account.
What we hope to achieve
We hope to put more EIC records under the same needle, to hold listening sessions with blind and low-vision people and publish what we learn, and to show that a picture of Earth data can be published with a sound and a sentence that carry the same number.
Tools, languages and software
- HTML, CSS and JavaScript (ES modules): no framework, no build step, no backend.
- Tone.js for sound (Web Audio) and three.js for the globe (WebGL).
- Python with NumPy, Pillow and OpenEXR to decode and validate the NASA frames.
- An acoustic guitar recorded by the team during the hackathon, CC0 sample libraries for the other instruments, and ElevenLabs text to speech for the optional voice guide.
- nginx in a Docker container to serve the app; Git and GitHub.
- AI coding assistants (large language models): see Use of Super Intelligence (SI).