Blue Marble Records

Documentation
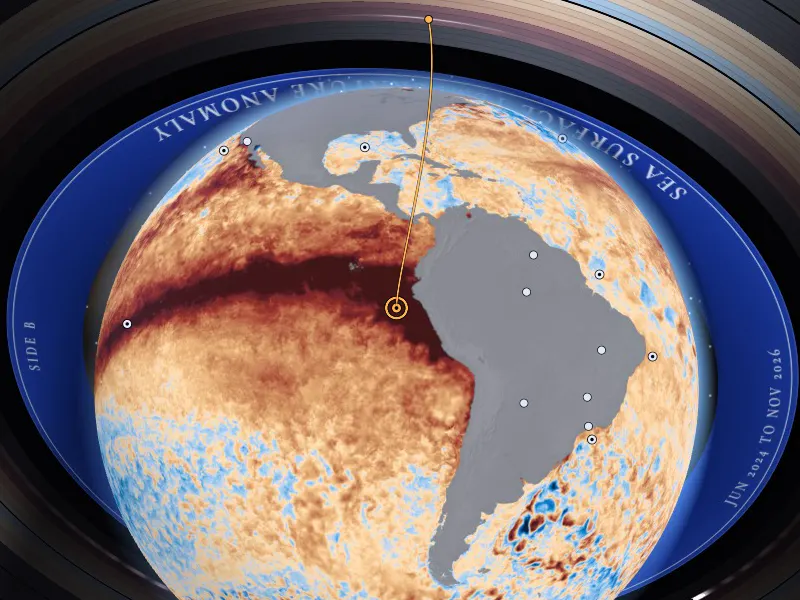
Screen capture of the app playing the sea record: the Earth sits in the middle of a vinyl record floating in space. The NASA frame laid over the globe shows a dark red band of warm water along the equatorial Pacific, and a thin amber needle line comes down to a ring off the coast of Peru.

Blue Marble Records: Hear the planet NASA sees.

A web app, made for blind and low-vision people and for anyone who wants to listen, that reads NASA Earth Information Center frames and plays them as music composed live in the browser.

Open the app Watch the 29 second demo Source code

Screen capture of the app playing the sea record. Frame: NASA SVS 5176.

Challenge
The Earth Information Jukebox, NASA Space Apps Challenge 2026
Local event
Uberlândia, Brazil
Built
14 and 15 November 2026
Team

Watch it play

The pictures are screen captures of the app and the music is the app's own sound, composed live from NASA data.

29 seconds, in English, with English subtitles. The narration is an SI-generated voice (ElevenLabs text to speech) reading a script written by the team.

Open the video file

How it works

The visitor picks one of 30 places on Earth. A needle reads that point of the NASA frame, decoded back into its physical value, and the browser composes music from the values live, date after date, like a record turning.

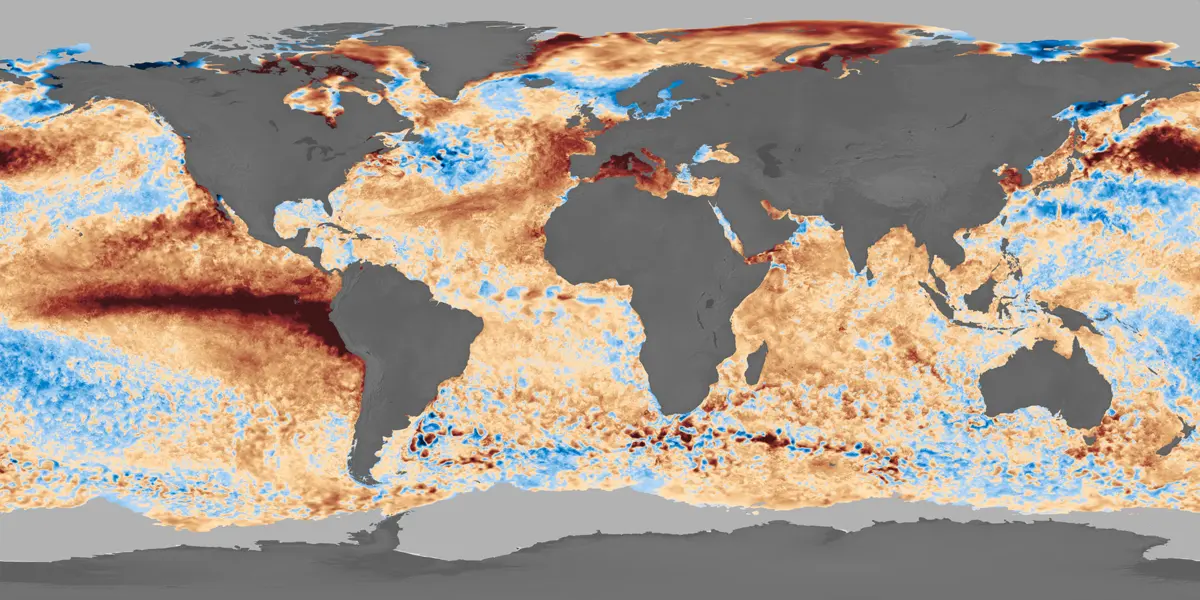
  1. A NASA frame of sea surface temperature anomaly as a flat world map: land in grey, cooler water in blue, warmer water in orange and red, with a dark red band across the equatorial Pacific.

    Step 1

    A NASA frame, decoded

    EIC frames are pictures, not data files. Ahead of time, Python scripts turn the pixels back into values: on the sea record with the colorbar NASA publishes with the visualization, on the fire record by comparing each pixel with an empty frame, the base map. Both are reduced to a 1 degree grid, one small image per date.

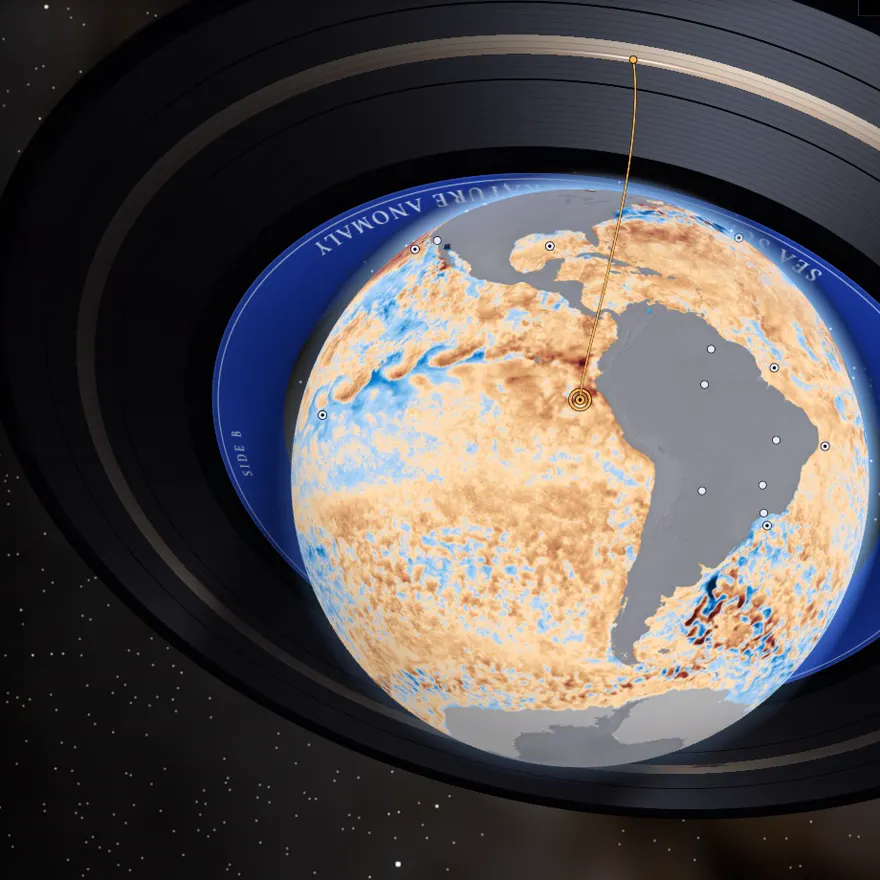
  2. Close view of the globe in the app: an amber line, the needle, comes down from the edge of the record to a ring on the ocean off Peru, where the NASA frame is dark red.

    Step 2

    The needle reads one place

    In the browser, the needle reads the cell that contains the chosen place and turns the pixel back into a value on the record's fixed scale.

  3. Step 3

    The values compose the music

    Nothing is a recorded song. The only recordings are single notes and single gestures of real instruments. Every chord, pattern and melody is decided while it plays, by rules we wrote, and the same data always gives the same music.

And in words: each reading is also one short sentence (place, date, value, unit), built from a template and sent to a single live region for the visitor's own screen reader. No language model runs in the app, and there is no backend.

The project in four numbers

records: sea surface temperature anomaly and active fires
2
places on Earth to pick, 17 on the ocean and 13 on land
30
mean absolute error of our reading of the temperature record, checked against NASA GIBS
0.17°C
of cells where our reading and NASA GIBS agree on fire or no fire
97.5%

Built for the ear

Earth data is published mostly as pictures. Here a person who cannot see the map can follow, by ear, how the sea warmed or cooled at one place and when fire came and went. Every control works from the keyboard, and every value is also a sentence for a screen reader.

  • Native controls

    Every control is a native HTML control. The 3D picture is hidden from assistive technology, and every choice it offers is also a button, a list or a slider.

  • One key map

    Up and down change the place, left and right switch between sea and fire, Space or Enter plays and pauses, Esc or S stops all sound. A keyboard guide lists every key.

  • Quiet until you act

    Nothing sounds until the visitor acts, and the music lowers while a sentence is announced.

  • No data has its own sound

    No data is never silence and never a low note: it is a soft vinyl crackle, the "dead groove".

  • A voice that says what it is

    The optional voice guide is a synthetic voice, labelled as one. It never reads the values and never speaks over the music.

  • Pulses in the hand

    On Android phones that can vibrate, the value is also given as 1 to 5 pulses, and no data as a rough buzz.

15 seconds. A blind tester listens to the app playing on her phone. Shown with her permission.

Tried by a blind listener

During the hackathon, on 15 November 2026, a blind person tried the app on her own phone, a Motorola Moto G54, with Google's Gemini on the phone. One person and one session: we report it as a first trial, not as a validation.

Data and validation

NASA data is the core of the project: the music is composed from values decoded from NASA Earth Information Center frames.

The frames are pictures, so we checked our reading of them against NASA GIBS, a separate NASA rendering of the same data. This tests our decoding, not the satellite data.

Screen capture of the sea record in the app: the globe wrapped in the sea surface temperature anomaly frame, inside a vinyl record whose blue label reads Sea Surface Temperature Anomaly.

Sea record

Sea Surface Temperature Anomaly

NASA visualization
NASA SVS 5176, sea surface temperature anomaly, near real time
Data behind it
MUR SST v4.1 anomaly (JPL)
Dates in the app
30 monthly snapshots, the 10th of each month, 10 June 2024 to 10 November 2026
What is played
Sea surface temperature anomaly, −4 to +4 °C
Checked against GIBS
Mean absolute error 0.17 °C, bias +0.04 °C, on 93 points on 8 dates
A comparison the app suggests
Equatorial Pacific (near 0°, 140°W): −0.66 °C on 10 November 2025, and at or above +4 °C (top of scale) on 10 November 2026
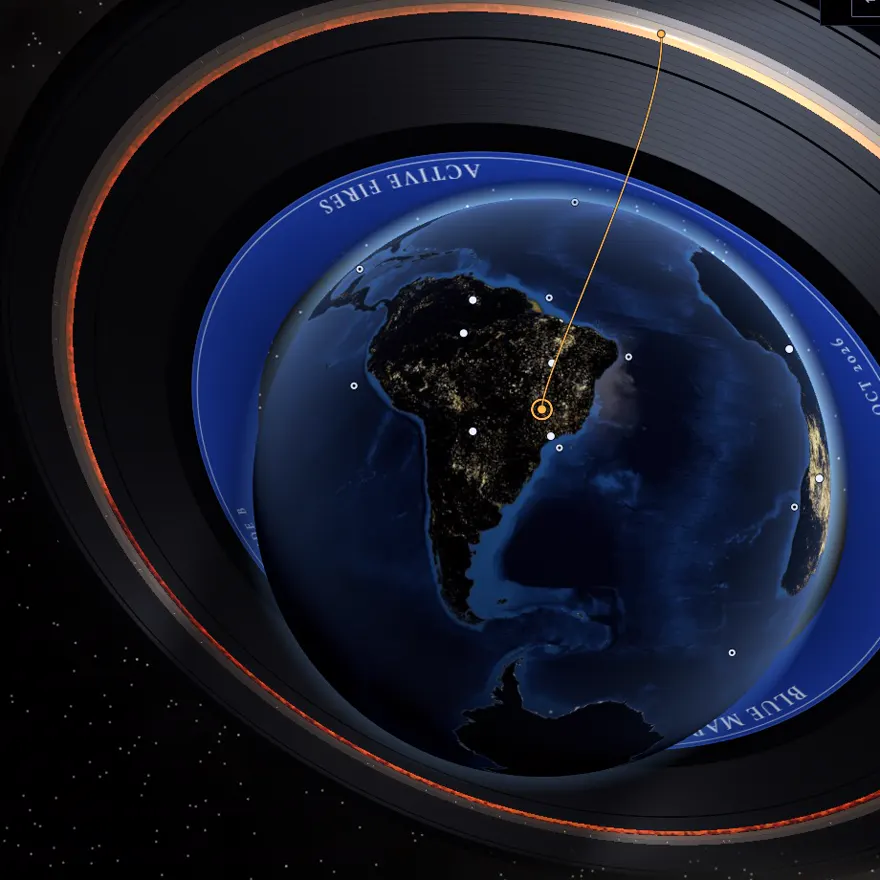
Screen capture of the fire record in the app: a dark globe showing South America with small bright fire dots, the needle on Uberlândia, a blue label reading Active Fires, and an orange glow running along a groove of the record.

Fire record

Active Fires

NASA visualization
NASA SVS 5113, active fires as observed by VIIRS
Data behind it
VIIRS active fires (Suomi NPP and NOAA-21), 5-day moving window
Dates in the app
23 monthly snapshots, the 10th of each month, 10 December 2024 to 10 October 2026
What is played
Fire activity (hot-pixel density), 0 to 50% of land pixels with fire dots
Checked against GIBS
Both agree on fire or no fire in 97.5% of cells, on 80 points on 5 dates. Rank correlation (Spearman rho) 0.97 over all sampled cells
A comparison the app suggests
Uberlândia, Brazil: fire dots on 1.2% of land pixels on 10 February 2025 (wet season) and on 22.0% on 10 September 2025 (dry season)

It says what the data cannot say: a value at the end of a scale is announced as such, and fire is given as fire activity (hot-pixel density), a relative number. Every compared point is published as validation.csv next to each record's data, and the full report is docs/VALIDATION.md. The complete method is under NASA Data below.

What SI did, and what it did not

Yes, we used SI tools. Each use is marked where it happens, in descriptive text and in metadata. The decisions about the concept, the mapping from data to sound and what ships were made by the team.

SI-assisted, and marked

  • Code of the app and of the data pipeline. Parts were drafted with AI coding assistants (large language models) and reviewed by a team member.
  • Validation scripts and report. Drafted with AI coding assistants and reviewed by Arthur. The numbers come from running the scripts.
  • Voice guide (optional) and narration of the demo video. An SI-generated voice: ElevenLabs text to speech, from lines written and reviewed by the team.
  • Preparation of the recorded notes. The scripts that cut the notes, measured their tuning and found their loop points were drafted with an AI coding assistant and reviewed by Otávio.
  • This page and the README. Drafted with an AI assistant and reviewed by the team.

Not SI-generated

  • The music. Recorded notes of real instruments, composed live in the browser from the data by rules the team wrote.
  • The images. NASA frames and NASA imagery. The record, the icons and the opening animation are drawn in code. No image was made with an image generator.
  • The data values. Every value is computed from a NASA frame by the pipeline. None was written by hand or produced by a model.
  • The app while it runs. No language model runs in the app. Its sentences are templates filled with the decoded values.

The complete list, with where each use is marked, is under Use of Super Intelligence (SI) below.

Documentation

The full text of the project: what it does and how it works, how SI was used, the NASA data behind it, and every reference and licence.

Summary

Blue Marble Records is a web app that turns NASA Earth Information Center (EIC) frames into music, made for blind and low-vision people. The visitor picks one of 30 places on Earth. A needle reads that point of the NASA frame, decoded back into its physical value, and the browser composes music from the values live, date after date, like a record turning. It has two records: sea surface temperature anomaly (NASA SVS 5176) and active fires seen by VIIRS (NASA SVS 5113).

It answers The Earth Information Jukebox by pairing EIC frames with sonification generated in real time from the picture itself: we read each number back from the frame's own pixels, and we checked that decoding against a separate NASA rendering (NASA GIBS). Every control works from the keyboard, and every value is also a sentence for a screen reader.

It matters because Earth data is published mostly as pictures. Here a person who cannot see the map can follow, by ear, how the sea warmed or cooled at one place and when fire came and went.

Demo video

https://otavioturatti.github.io/Blue-Marble-Records-Nasa/demo.mp4

29 seconds, in English, with English subtitles. The pictures are screen captures of the app and the music is the app's own sound, composed live from NASA data. The narration is an SI-generated voice (ElevenLabs text to speech) reading a script written by the team.

The video plays at the top of this page.

Live app and source code

Live app https://blue.oantitrend.com/

Code repository https://github.com/otavioturatti/Blue-Marble-Records-Nasa

The repository holds the app (web/), the Python scripts that decode and validate the NASA frames (pipeline/), the validation report (docs/VALIDATION.md) and the licence (LICENSE).

Project description

What it does

The page opens on one question, "How do you want to start?", and three choices: a guided tour with the visitor's own screen reader, a guided tour with the app's voice, or "Explore on my own". The interface comes in English and Brazilian Portuguese.

The guided tour visits four places: the North Atlantic south of Greenland and the equatorial Pacific on the sea record, then Uberlândia (Brazil) and the miombo woodlands of Angola on the fire record, playing each record from start to end.

Exploring freely, the visitor chooses a record and one of its saved places (17 on the ocean, 13 on land), and can:

  • Play through time: the values of that place become music, one date after another.
  • Compare: hear the same place on two dates together. One note means little change; two notes beating against each other mean it changed.
  • Hear the sound legend: low, middle, high, and the crackle that means no data.
  • Ask in words: keys that say the value under the needle, the place with its latitude and longitude, and the highest and lowest places on that date.
  • Open "Data and method": the source, scale, validation numbers and method of each record.

For sighted visitors the same state is drawn as a picture: the Earth in space with the NASA frame of the date laid over it, and a vinyl record around it whose grooves are the dates.

How it works

  1. Decoding, done ahead of time in Python. EIC frames are pictures, not data files. On the sea record, each pixel takes the value of the nearest color of the colorbar NASA publishes with the visualization, measured in the CIELAB color space; pixels far from every colorbar color (land, sea ice, coasts) are "no data". On the fire record, a pixel is fire when it differs clearly from the same pixel of an empty frame, the base map. Both are reduced to a 1 degree grid, one small image per date.
  2. Reading, in the browser. The needle reads the cell that contains the chosen place and turns the pixel back into a value on the record's fixed scale.
  3. Music, composed live. Nothing is a recorded song. The only recordings are single notes and single gestures of real instruments: our own guitar and CC0 sample libraries. Every chord, pattern and melody is decided while it plays, by rules we wrote. On the sea record the distance from normal sets the tension, warmer water sounds bright and colder water dark, and each date lasts one bar; when the temperature moves by three quarters of a degree or more, a harp runs up (warmer) or down (colder). On the fire record, more fire activity means more tension and a heavier, louder band, and the harp runs up for more fire, down for less. The place sets the key and the tempo, and the same data always gives the same music.
  4. Words. Each reading is also one short sentence (place, date, value, unit), built from a template and sent to a single live region for the visitor's own screen reader. No language model runs in the app, and there is no backend.

Built for the ear

  • Every control is a native HTML control. The 3D picture is hidden from assistive technology, and every choice it offers is also a button, a list or a slider.
  • One key map holds everywhere: up and down change the place, left and right switch between sea and fire, Space or Enter plays and pauses, Esc or S stops all sound. A keyboard guide lists every key.
  • Nothing sounds until the visitor acts, and the music lowers while a sentence is announced.
  • No data is never silence and never a low note: it is a soft vinyl crackle, the "dead groove".
  • The optional voice guide is a synthetic voice, labelled as one. It never reads the values and never speaks over the music.
  • On Android phones that can vibrate, the value is also given as 1 to 5 pulses, and no data as a rough buzz.

During the hackathon, on 15 November 2026, a blind person tried the app on her own phone, a Motorola Moto G54, with Google's Gemini on the phone. One person and one session: we report it as a first trial, not as a validation.

Benefits

  • A person who cannot see the map has a way to follow one place through time, by ear and in words, without asking anyone to describe a picture.
  • The mapping is fixed and written down, so a listener can learn it once and compare places and dates.
  • It says what the data cannot say: a value at the end of a scale is announced as such, and fire is given as fire activity (hot-pixel density), a relative number.
  • It runs in a browser, with no install and no account.

What we hope to achieve

We hope to put more EIC records under the same needle, to hold listening sessions with blind and low-vision people and publish what we learn, and to show that a picture of Earth data can be published with a sound and a sentence that carry the same number.

Tools, languages and software

  • HTML, CSS and JavaScript (ES modules): no framework, no build step, no backend.
  • Tone.js for sound (Web Audio) and three.js for the globe (WebGL).
  • Python with NumPy, Pillow and OpenEXR to decode and validate the NASA frames.
  • An acoustic guitar recorded by the team during the hackathon, CC0 sample libraries for the other instruments, and ElevenLabs text to speech for the optional voice guide.
  • nginx in a Docker container to serve the app; Git and GitHub.
  • AI coding assistants (large language models): see Use of Super Intelligence (SI).

Use of Super Intelligence (SI)

Yes, we used SI tools. Each use is marked where it happens, in descriptive text and in metadata.

What SI did, and where it is marked

Code of the app and of the data pipeline
How SI was used
Parts were drafted with AI coding assistants (large language models) and reviewed by a team member.
Where it is marked
An "SI disclosure" line at the top of each file names the member who reviewed it.
Data files
How SI was used
The values are computed from the NASA frames by that pipeline, whose code was SI-assisted.
Where it is marked
The provenance entry of each record's meta.json ("si_assisted_code": true).
Validation scripts and report
How SI was used
Drafted with AI coding assistants and reviewed by Arthur. The numbers come from running the scripts.
Where it is marked
The SI disclosure note at the top of docs/VALIDATION.md.
Voice guide (optional)
How SI was used
An SI-generated voice: ElevenLabs text to speech, from lines written and reviewed by the team. It is not a recording of a person. A speech recognition model run on our own computer (faster-whisper) transcribed each clip, so it could be compared word by word with its line. If a clip cannot load, the browser's own speech synthesis says the same line.
Where it is marked
Labelled "synthetic voice" in the interface, described in web/voice/README.md, and stated in the comment tag of each audio file.
Preparation of the recorded notes
How SI was used
The scripts that cut the notes, measured their tuning and found their loop points were drafted with an AI coding assistant and reviewed by Otávio.
Where it is marked
web/vendor/samples/README.md.
Narration of the demo video
How SI was used
An SI-generated voice: ElevenLabs text to speech, reading a script written by the team. The pictures and the music of the video are not SI-generated.
Where it is marked
The line "Narration: SI-generated voice" on screen for the whole video, and the comment tag of the video file.
This page and the README
How SI was used
Drafted with an AI assistant and reviewed by the team.
Where it is marked
The footer of this page and its generator metadata; the SI section of README.md.

What is not SI-generated

  • The music. Recorded notes of real instruments, composed live in the browser from the data by rules the team wrote. No file among the recorded notes was made by a generative model. The reference sounds (the needle drop, the crackle of no data, single tones) are synthesized in the browser by our own code.
  • The images. NASA frames and NASA imagery, credited under References. The record, the icons and the opening animation are drawn in code. No image was made with an image generator.
  • The data values. Every value is computed from a NASA frame by the pipeline. None was written by hand or produced by a model.
  • The app while it runs. No language model runs in the app. Its sentences are templates filled with the decoded values.

The decisions about the concept, the mapping from data to sound and what ships were made by the team. Nothing we generated uses, contains or modifies NASA logos, flags or mission identifiers.

NASA Data

NASA data is the core of the project: the music is composed from values decoded from NASA Earth Information Center frames.

The two records and their NASA sources

Sea record
Title in the app
Sea Surface Temperature Anomaly
NASA visualization
NASA SVS 5176, sea surface temperature anomaly, near real time
Data behind it
MUR SST v4.1 anomaly (JPL)
Dates in the app
30 monthly snapshots, the 10th of each month, 10 June 2024 to 10 November 2026
What is played
Sea surface temperature anomaly, −4 to +4 °C. A value at or beyond either end reads as the end of the scale.
How a value is decoded
Nearest colorbar color in CIELAB, then the median of the valid pixels of each 1 degree cell. A cell with fewer than half valid pixels is no data.
Fire record
Title in the app
Active Fires
NASA visualization
NASA SVS 5113, active fires as observed by VIIRS
Data behind it
VIIRS active fires (Suomi NPP and NOAA-21), 5-day moving window
Dates in the app
23 monthly snapshots, the 10th of each month, 10 December 2024 to 10 October 2026
What is played
Fire activity (hot-pixel density), 0 to 50% of land pixels with fire dots. Anything above reads as the top of the scale.
How a value is decoded
Pixels that differ from the empty base map are fire, then fire pixels over land pixels in each 1 degree cell. A cell that is less than half land is no data.

How we use the frames as data

The challenge's resources link the EIC gallery, whose Daily Visualizations page lists both visualizations. We took the unlabeled equirectangular frames (4096 by 2048 pixels) for the 10th of each month and decoded them with the Python scripts in pipeline/. The browser does not read NASA's servers: it loads the small files that decoding produced (web/data/), whose format is described in docs/DATA-FORMAT.md.

How we checked the decoding

The frames are pictures, so we checked our reading of them against NASA GIBS, a separate NASA rendering of the same data. This tests our decoding, not the satellite data. GIBS is used only for this check, never as a source of the values the app plays.

Sea record, checked against NASA GIBS
Reference
GIBS layer GHRSST_L4_MUR_Sea_Surface_Temperature_Anomalies (0.1 °C classes), median of the same 1 degree cell
Sample
93 points on 8 dates. Left out: 2 at the end of the scale and 1 with no reference value.
Result
Mean absolute error 0.17 °C, bias +0.04 °C. 90% of points within 0.34 °C, 77.4% within 0.25 °C. 88.2% in the same class (cold below −0.5 °C, neutral, warm above +0.5 °C).
Fire record, checked against NASA GIBS
Reference
GIBS layers VIIRS_SNPP_Thermal_Anomalies_375m_All and VIIRS_NOAA21_Thermal_Anomalies_375m_All, union of the 5 days ending on the date, same 1 degree cell
Sample
80 points on 5 dates. The cells without fire were drawn from land within 3 cells of fire, between 60°S and 60°N, outside Greenland.
Result
Both agree on fire or no fire in 97.5% of cells (1 cell with fire in the reference only, 1 in ours only). Rank correlation (Spearman rho) 0.97 over all sampled cells and 0.94 among the 41 cells with fire on either side. Amounts are compared by rank only, because GIBS draws the same detections at a different size.

Every compared point is published as validation.csv next to each record's data, the same numbers are shown in the app under "Data and method", and the full report is docs/VALIDATION.md.

What the numbers can and cannot say

  • Top of scale. The sea scale ends at −4 and +4 °C. A value at the top is given as "at or above +4 °C (top of scale)", never as a measured number.
  • Fire is fire activity (hot-pixel density). The value is the share of land pixels covered by detection dots in the NASA rendering. It is relative: not a measure of fire power, and not the share of land that burned.
  • Snapshots. Each sea date is one daily frame, not a monthly mean, and each fire date is one 5-day window. On the fire record, 10 November 2026 is left out because the newest frames were still being filled in.
  • El Niño and La Niña are never read from the pixels. They are cited from the NOAA Climate Prediction Center.
  • No data has its own sound and its own words, so a missing value is not mistaken for a low one.

Two comparisons the app suggests

  • Equatorial Pacific (near 0°, 140°W), sea record: −0.66 °C on 10 November 2025, and at or above +4 °C (top of scale) on 10 November 2026. The NOAA Climate Prediction Center issued a La Niña Advisory on 13 November 2025 and an El Niño Advisory on 12 November 2026.
  • Uberlândia, Brazil, fire record: fire dots on 1.2% of land pixels on 10 February 2025 (wet season) and on 22.0% on 10 September 2025 (dry season).

Other NASA resources

  • NASA Earth Observatory, Blue Marble Next Generation: the picture of the Earth on the globe.
  • NASA SVS 4851, Deep Star Maps 2020: the sky behind the globe.
  • NASA SVS 4720, CGI Moon Kit: the Moon.
  • JPL, "Approximate Positions of the Planets" (E. M. Standish): where the planets are drawn for the date shown.

References

Space Agency Partner data

None. We did not use data or resources from the 2026 Space Agency Partners.

NASA data and imagery
  • NASA Scientific Visualization Studio (SVS) 5176: sea surface temperature anomaly, near real time (MUR SST v4.1 anomaly, JPL). The frames and the colorbar of the sea record.
  • NASA SVS 5113: active fires as observed by VIIRS (Suomi NPP and NOAA-21, 5-day moving window). The frames of the fire record.
  • NASA SVS, Earth Information Center gallery and its Daily Visualizations page.
  • NASA GIBS, used only to validate our decoding: layers GHRSST_L4_MUR_Sea_Surface_Temperature_Anomalies, VIIRS_SNPP_Thermal_Anomalies_375m_All and VIIRS_NOAA21_Thermal_Anomalies_375m_All.
  • JPL MUR SST v4.1 (PO.DAAC): the dataset drawn in SVS 5176. Our values come from the frames.
  • NASA Earth Observatory, Blue Marble Next Generation (with topography and bathymetry): the Earth and cloud pictures of the globe.
  • NASA SVS 4851, Deep Star Maps 2020: the sky and the star positions.
  • NASA SVS 4720, CGI Moon Kit: the picture of the Moon.

Licence: NASA media, generally not copyrighted (NASA media usage guidelines). No NASA logo is used.

Other data and reference texts
Code libraries shipped with the app
  • Tone.js 15.1.22, by Yotam Mann. MIT licence, copied in web/vendor/Tone.LICENSE.txt.
  • three.js r170, by the Three.js Authors. MIT licence.
Recorded instruments

Every file is one note of a real instrument, played by a person, or one gesture of an instrument. None is a song, a phrase or a chord.

Instruments
Acoustic guitar, every fret (0 to 12) of the six strings
Source
Recorded by the team for this project during the hackathon (files dated 14 November 2026)
Licence
Our own work
Instruments
Folk harp (played by Jordi Francis, Etherealwinds), grand piano (Steinway B), baroque recorders, vibraphone, glockenspiel, marimba, Nyunga Nyunga (Mozambique), mbira dzaVadzimu (Zimbabwe), ocarinas, wine glasses, ocean drum, cabasa, wind chimes, and percussion: cajón, frame drum, bass drum, darbuka, triangle, hand claps, suspended cymbals, timpani, tubular bells
Source
Versilian Community Sample Library (VCSL), Versilian Studios LLC (Sam Gossner), revision c1ea7bcc3c7309650ab0da9d15c9cd1fbc4a4c7e
Licence
CC0 1.0
Instruments
Concert flute, clarinet, French horn in F, cello section, violin section (tremolo), double bass (pizzicato)
Source
VS Chamber Orchestra: Community Edition (VSCO 2 CE), Versilian Studios LLC (Sam Gossner), recorded by Sam Gossner and Simon Dalzell, revision 440300901dfe9275fd84e0b7763af1f8443ae62e
Licence
CC0 1.0
Instruments
Hohner button accordion ("Button Accordion HN", version 2024-03-29), recorded by Jeff Stauffer, edited by michael02022
Licence
CC0 1.0

CC0 1.0 Universal: creativecommons.org/publicdomain/zero/1.0/. We kept only the notes the music plays, made them mono, measured their tuning and marked loop points on the sustained notes. Each instrument, its original file names and what we changed are listed in web/vendor/samples/README.md and in the manifest.json of each folder.

Fonts of the app

All four are under the SIL Open Font License 1.1. This page uses the same four fonts, served from its own folder.

Voice guide
  • ElevenLabs text to speech, model eleven_v4, voices "James" (English) and "Rafael Valente" (Brazilian Portuguese): 81 clips in each language, synthesized on 15 November 2026 from lines written and reviewed by the team. SI-generated, as stated under Use of Super Intelligence (SI) and in web/voice/README.md.
  • faster-whisper, a speech recognition model run on our own computer, used only to check each clip against its line. It is not part of the app.
Tools used to build and serve
  • Python with NumPy (BSD 3-Clause), Pillow (MIT-CMU) and OpenEXR (BSD 3-Clause): the scripts in pipeline/.
  • nginx (BSD 2-Clause), from the image nginx:1.27-alpine, and Docker.
  • Git and GitHub.
  • AI coding assistants (large language models), as stated under Use of Super Intelligence (SI).
Lineage

Blue Marble Records follows earlier work that turned data into sound, or opened data to people who cannot see it. We cite it as prior art, and none of its code, audio or images is used here: the Voyager Golden Record; the Caldwell 73 sonification (NASA SVS 13786), which the challenge lists among its resources; "A Universe of Sound" from NASA's Chandra X-ray Observatory; iSonic; Accessible Oceans; and NASA's "Atmospheric Symphony".

Licence of our own work

Our own work in the repository is offered under the Apache License 2.0 (see LICENSE in the repository root). Third-party materials keep the licences listed above.

How to run it

With Docker, from the root of the repository:

docker build -t blue-marble-records .
docker run -p 8080:80 blue-marble-records

Then open http://localhost:8080/ in a browser. Without Docker, serve the web/ folder with any static file server. There is no backend and no build step.